How to scrape Yahoo Finance and extract fundamental stock market data using Python, LXML, and Pandas
- Apr 3, 2020
In this blog post I’ll show you how to scrape Income Statement, Balance Sheet, and Cash Flow data for companies from Yahoo Finance using Python, LXML, and Pandas.
I’ll use data from Mainfreight NZ (MFT.NZ) as an example, but the code will work for any stock symbol on Yahoo Finance.
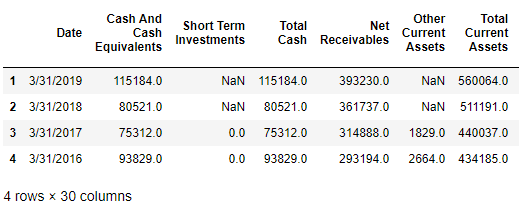
The screenshot below shows a Pandas DataFrame with MFT.NZ balance sheet data, which you can expect to get by following the steps in this blog post:
After taking you step by step on how to fetch data from the balance sheet, I’ll show you how to generalise the code to also generate a DataFrame containing data from the Income Statement, and Cash Flow statement.
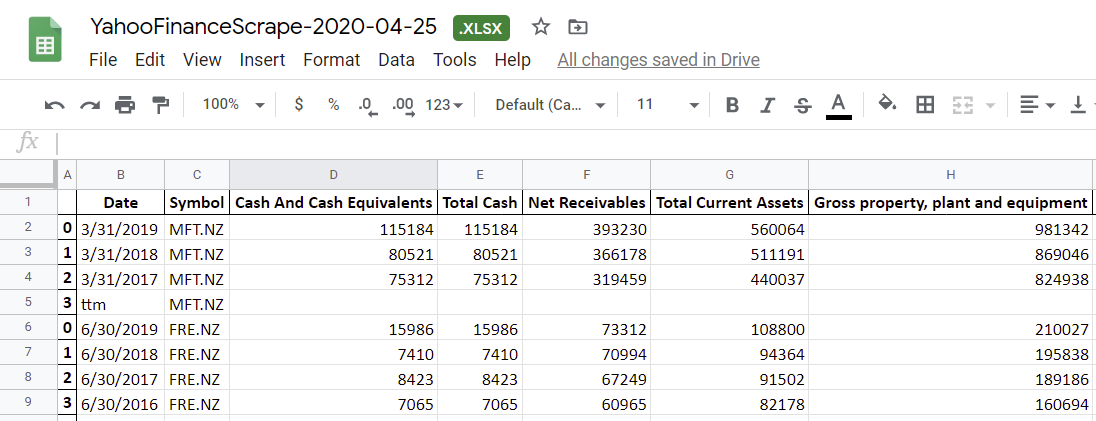
After creating the Pandas DataFrames, I’ll then show you how to scrape data for multiple symbols, and finally, export everything to an Excel file, so you’ll have output that looks something like this:
This post was last updated in April, 2020.
Prior to October, 2019, Yahoo Finance conveniently had all this data in a regular HTML table, which made extracting the data super easy. Since then, they’ve updated the page with a new structure, which was a wee bit tricker to get the data from. Fortunately, it’s still possible. Read on to find out how.
Disclaimers
Before we start, a few disclaimers:
- This code doesn’t come with any guarantee or warranty.
- I’m not a financial advisor. This blog post doesn’t represent financial advice.
- I don’t recommend the use of this code for any investment decisions.
- This code is designed for personal use, and isn’t designed for high-volume extractions.
- Use the code at your own risk.
Prerequisites
Make sure you have installed the Anaconda distribution of Python .. this includes Jupyter Notebook, which we’ll use throughout this blog post.
Now we begin!
Find the ticker symbol
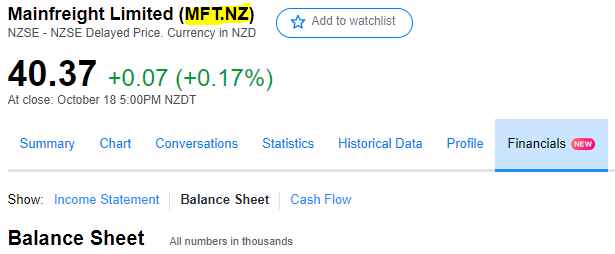
In this case, we’ll be scraping data for Mainfreight NZ.
In Yahoo Finance, the symbol for Mainfreight is MFT.NZ:
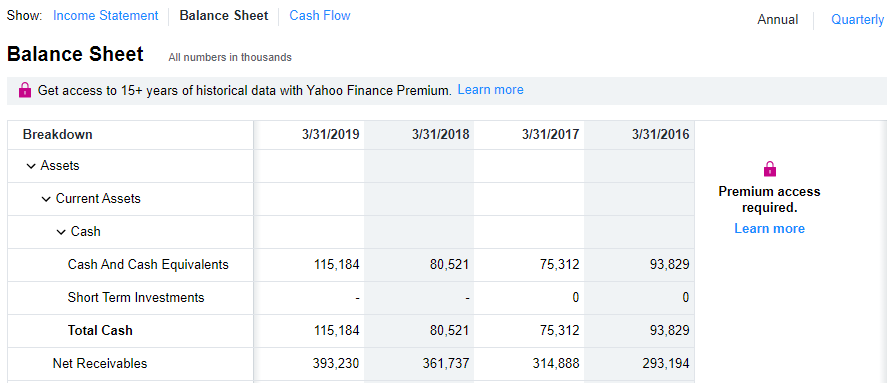
Take a look at the Balance Sheet data that we’re going to scrape.
Here’s an example of some of the financial data we’ll be wanting to extract. Take note of the data displayed. Once we’ve scraped the data, we’ll cross-check it to ensure the scraping was accurate.
Inspect the page source
Open up the Chrome developer tools, and inspect the page source. If you inspect the “Cash And Cash Equivalents” row, you’ll see something like this:
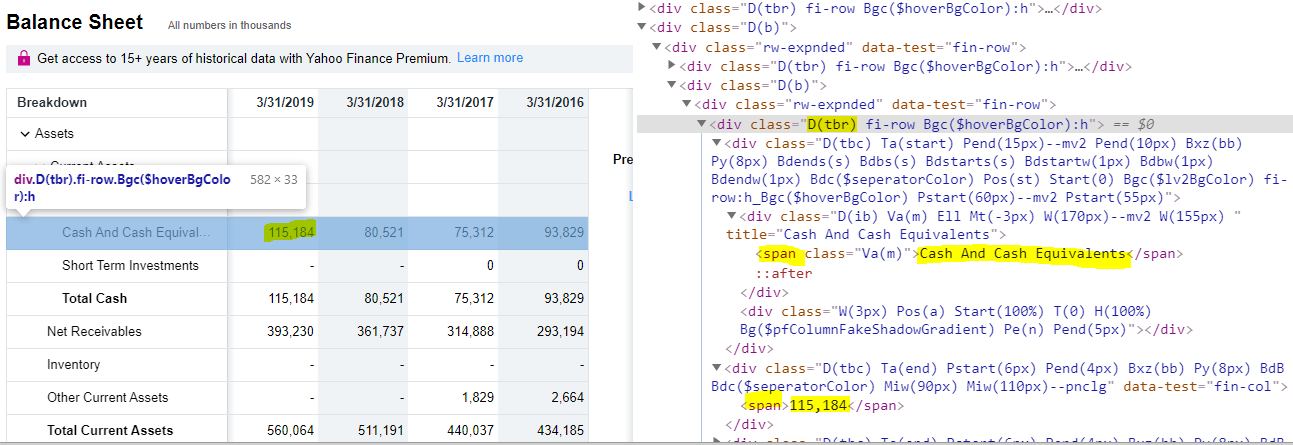
Note that:
- Table rows in the table have the class
D(tbr) - Values such as
Cash And Cash Equivalentsand115,184are within aspanwithin each row - This is true for all rows in the table, including the first row titled
Breakdownwith dates such as3/31/2019
Because of this, we can use XPath queries to extract the data that we want.
Scrape some balance sheet data
Open up Jupyter Notebook, and execute the following code block:
from datetime import datetime
import lxml
from lxml import html
import requests
import numpy as np
import pandas as pd
symbol = 'MFT.NZ'
url = 'https://finance.yahoo.com/quote/' + symbol + '/balance-sheet?p=' + symbol
# Set up the request headers that we're going to use, to simulate
# a request by the Chrome browser. Simulating a request from a browser
# is generally good practice when building a scraper
headers = {
'Accept': 'text/html,application/xhtml+xml,application/xml;q=0.9,image/webp,image/apng,*/*;q=0.8,application/signed-exchange;v=b3',
'Accept-Encoding': 'gzip, deflate, br',
'Accept-Language': 'en-US,en;q=0.9',
'Cache-Control': 'max-age=0',
'Connection': 'close',
'DNT': '1', # Do Not Track Request Header
'Pragma': 'no-cache',
'Referrer': 'https://google.com',
'User-Agent': 'Mozilla/5.0 (Windows NT 10.0; Win64; x64) AppleWebKit/537.36 (KHTML, like Gecko) Chrome/92.0.4515.107 Safari/537.36'
}
# Fetch the page that we're going to parse, using the request headers
# defined above
page = requests.get(url, headers=headers)
# Parse the page with LXML, so that we can start doing some XPATH queries
# to extract the data that we want
tree = html.fromstring(page.content)
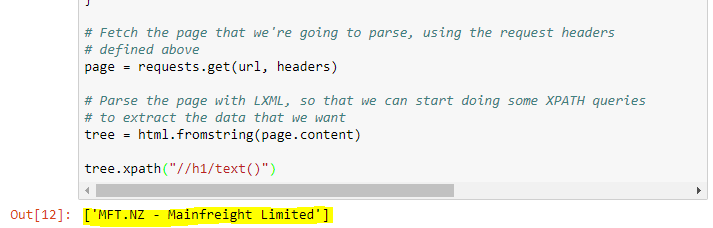
# Smoke test that we fetched the page by fetching and displaying the H1 element
tree.xpath("//h1/text()")You should see some output which looks like the following:
Reading the financial data
Add a new cell to your Jupyter notebook, and add the following:
table_rows = tree.xpath("//div[contains(@class, 'D(tbr)')]")

# Ensure that some table rows are found; if none are found, then it's possible
# that Yahoo Finance has changed their page layout, or have detected
# that you're scraping the page.
assert len(table_rows) > 0

parsed_rows = []

for table_row in table_rows:
    parsed_row = []
    el = table_row.xpath("./div")

    none_count = 0

    for rs in el:
        try:
            (text,) = rs.xpath('.//span/text()[1]')
            parsed_row.append(text)
        except ValueError:
            parsed_row.append(np.NaN)
            none_count += 1

    if (none_count < 4):
        parsed_rows.append(parsed_row)

df = pd.DataFrame(parsed_rows)
df
After executing the code, you should see output which looks like:
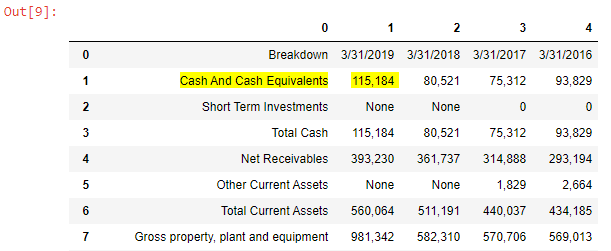
There are a few observations to be taken from the screenshot of the Pandas DataFrame above:
- The header row contains index values (0, 1, 2, 3, etc), rather than useful column names.
- The first row of the table contains dates.
- The first column contains account names.
- Rows such as Short Term Investments contain “None” where there are dashes (which represent no value) in Yahoo Finance, and 0’s when there are 0’s.
Cross-check this output with the Balance Sheet in Yahoo Finance. The data should match. For example:
Next, we’ll do some data cleanups and transformations to make the data more useful.
Clean up the data
Because we’re using Pandas, it’ll be more convenient if the columns are the account names, and the rows are indexed by Date, so let’s do that now:
df = pd.DataFrame(parsed_rows)
df = df.set_index(0) # Set the index to the first column: 'Period Ending'.
df = df.transpose() # Transpose the DataFrame, so that our header contains the account names

# Rename the "Breakdown" column to "Date"
cols = list(df.columns)
cols[0] = 'Date'
df = df.set_axis(cols, axis='columns', inplace=False)

df
You should now see output which looks like:
Much better!
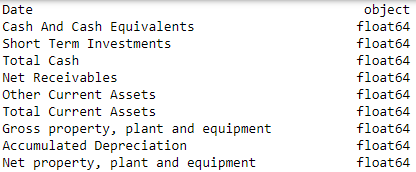
Now, let’s look at the data types of these columns:
df.dtypes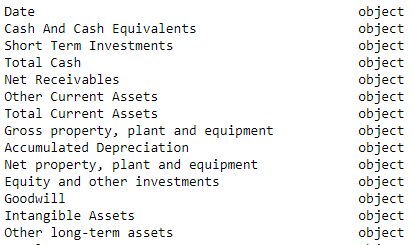
A few observations:
- Period Ending is of type ‘object’ when it should be a date type. We’re not going to be able to convert this to a date column since Income Statement and Statement of Cash Flows have “ttm” as the date value of the first column.
- All other columns such as Cash and Cash Equivalents are also of type ‘object’ when they should be numeric.
Let’s do the conversion to numeric:
numeric_columns = list(df.columns)[1::] # Take all columns, except the first (which is the 'Date' column)

for column_name in numeric_columns:
    df[column_name] = df[column_name].str.replace(',', '') # Remove the thousands separator
    df[column_name] = df[column_name].astype(np.float64) # Convert the column to float64

df.dtypes
The numeric columns should be now of type float64:
Let’s have another look at the DataFrame,:
dfWhich should output something something like:
Looking good! Now the Balance Sheet data has been fully scraped, with correct data types, in a form that’s ready to use.
Scraping Income Statement data from Yahoo Finance
Now we’ll create a more generalised form of the code above, by combining the code into a bunch of methods:
from datetime import datetime
import lxml
from lxml import html
import requests
import numpy as np
import pandas as pd

def get_page(url):
    # Set up the request headers that we're going to use, to simulate
    # a request by the Chrome browser. Simulating a request from a browser
    # is generally good practice when building a scraper
    headers = {
        'Accept': 'text/html,application/xhtml+xml,application/xml;q=0.9,image/webp,image/apng,*/*;q=0.8,application/signed-exchange;v=b3',
        'Accept-Encoding': 'gzip, deflate, br',
        'Accept-Language': 'en-US,en;q=0.9',
        'Cache-Control': 'max-age=0',
        'Connection': 'close',
        'DNT': '1', # Do Not Track Request Header
        'Pragma': 'no-cache',
        'Referrer': 'https://google.com',
        'User-Agent': 'Mozilla/5.0 (Windows NT 10.0; Win64; x64) AppleWebKit/537.36 (KHTML, like Gecko) Chrome/92.0.4515.107 Safari/537.36'
    }

    return requests.get(url, headers=headers)

def parse_rows(table_rows):
    parsed_rows = []

    for table_row in table_rows:
        parsed_row = []
        el = table_row.xpath("./div")

        none_count = 0

        for rs in el:
            try:
                (text,) = rs.xpath('.//span/text()[1]')
                parsed_row.append(text)
            except ValueError:
                parsed_row.append(np.NaN)
                none_count += 1

        if (none_count < 4):
            parsed_rows.append(parsed_row)

    return pd.DataFrame(parsed_rows)

def clean_data(df):
    df = df.set_index(0) # Set the index to the first column: 'Period Ending'.
    df = df.transpose() # Transpose the DataFrame, so that our header contains the account names

    # Rename the "Breakdown" column to "Date"
    cols = list(df.columns)
    cols[0] = 'Date'
    df = df.set_axis(cols, axis='columns', inplace=False)

    numeric_columns = list(df.columns)[1::] # Take all columns, except the first (which is the 'Date' column)

    for column_index in range(1, len(df.columns)): # Take all columns, except the first (which is the 'Date' column)
        df.iloc[:,column_index] = df.iloc[:,column_index].str.replace(',', '') # Remove the thousands separator
        df.iloc[:,column_index] = df.iloc[:,column_index].astype(np.float64) # Convert the column to float64

    return df

def scrape_table(url):
    # Fetch the page that we're going to parse
    page = get_page(url);

    # Parse the page with LXML, so that we can start doing some XPATH queries
    # to extract the data that we want
    tree = html.fromstring(page.content)

    # Fetch all div elements which have class 'D(tbr)'
    table_rows = tree.xpath("//div[contains(@class, 'D(tbr)')]")

    # Ensure that some table rows are found; if none are found, then it's possible
    # that Yahoo Finance has changed their page layout, or have detected
    # that you're scraping the page.
    assert len(table_rows) > 0

    df = parse_rows(table_rows)
    df = clean_data(df)

    return df
Check that scraping still works for the balance sheet. You should get the same output as the final balance sheet above. The only change will be that the ‘Period Ending’ column is now called ‘Date’:
symbol = 'MFT.NZ'
df_balance_sheet = scrape_table('https://finance.yahoo.com/quote/' + symbol + '/balance-sheet?p=' + symbol)
Scraping the Income Statement from Yahoo Finance
Now that we’ve got the Balance Sheet, let’s try re-using scrape_table for the Income Statement:
scrape_table('https://finance.yahoo.com/quote/' + symbol + '/financials?p=' + symbol)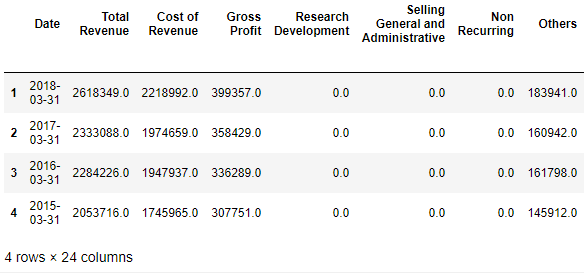
Cross check these values with the Income Statement on Yahoo Finance:
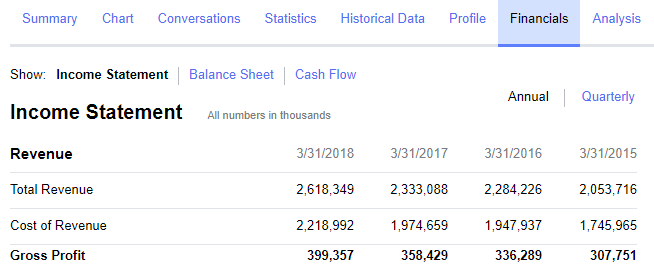
and they match!
Scraping Statement of Cash Flows data from Yahoo Finance
Now that we’ve got a generic method that can be used on the Balance Sheet, and Income Statement, let’s try it on the Cash Flow statement.
scrape_table('https://finance.yahoo.com/quote/' + symbol + '/cash-flow?p=' + symbol)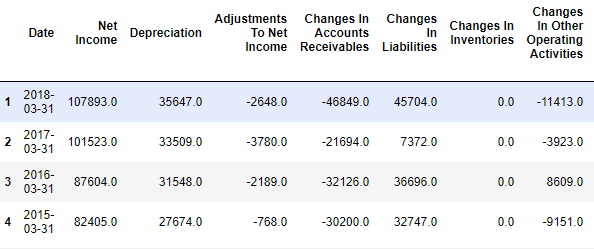
Cross check these values with the Statement of Cash Flows on Yahoo Finance:
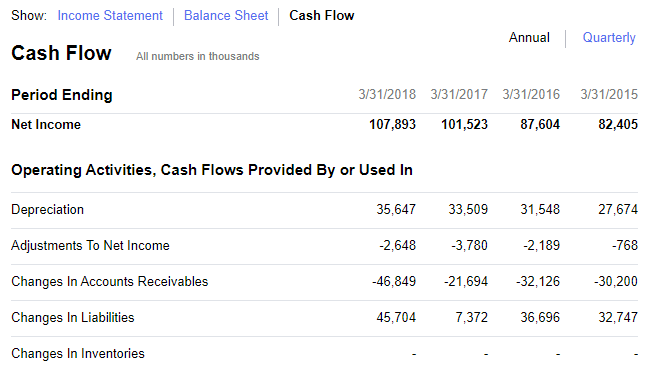
and they match!
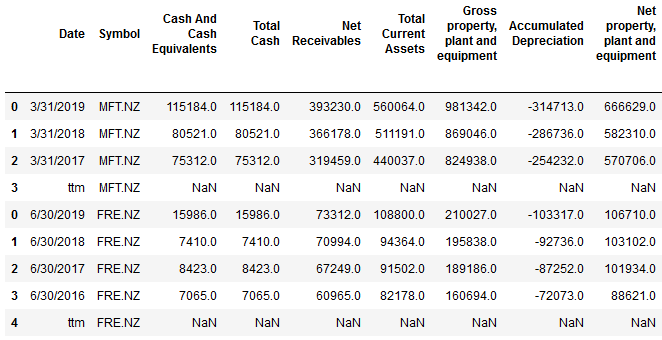
Scraping multiple symbols
By this point, we’ve successfully scraped the Income Statement, Balance Sheet, and Statement of Cash Flows, let’s extend the code to support scraping multiple symbols. In addition to MFT.NZ, we’ll also scrape data for another freight company, FRE.NZ.
Start by putting the code to scrape the data into a function which scrapes Income Statement, Balance Sheet, and Statement of Cash Flow data for a single symbol, and puts it all into a single dataframe:
def scrape(symbol):
    print('Attempting to scrape data for ' + symbol)

    df_balance_sheet = scrape_table('https://finance.yahoo.com/quote/' + symbol + '/balance-sheet?p=' + symbol)
    df_balance_sheet = df_balance_sheet.set_index('Date')

    df_income_statement = scrape_table('https://finance.yahoo.com/quote/' + symbol + '/financials?p=' + symbol)
    df_income_statement = df_income_statement.set_index('Date')

    df_cash_flow = scrape_table('https://finance.yahoo.com/quote/' + symbol + '/cash-flow?p=' + symbol)
    df_cash_flow = df_cash_flow.set_index('Date')

    df_joined = df_balance_sheet \
        .join(df_income_statement, on='Date', how='outer', rsuffix=' - Income Statement') \
        .join(df_cash_flow, on='Date', how='outer', rsuffix=' - Cash Flow') \
        .dropna(axis=1, how='all') \
        .reset_index()

    df_joined.insert(1, 'Symbol', symbol)

    return df_joined
Then add a method which enables iterating over a list of symbols, creating a combined dataframe:
def scrape_multi(symbols):
    return pd.concat([scrape(symbol) for symbol in symbols], sort=False)
Call the method with the list of symbols:
symbols = ['MFT.NZ', 'FRE.NZ']
df_combined = scrape_multi(symbols)
You should see output something like:
Exporting to Excel
Now that we’ve successfully scraped the Income Statement, Balance Sheet, and Statement of Cash Flows, let’s export the data to Excel for futher analysis:
It’s possible to export the Pandas DataFrame to Excel via ExcelWriter.
Below is the code to export to an Excel file with three worksheets; Income Statement, Balance Sheet, and Statement of Cash Flows
date = datetime.today().strftime('%Y-%m-%d')
writer = pd.ExcelWriter('Yahoo-Finance-Scrape-' + date + '.xlsx')
df_combined.to_excel(writer)
writer.save()
I imported the file into Google Sheets, and got the following:
Want to read more?
Thanks for Reading!
In this blog post, I’ve shown you how to scrape Income Statement, Balance Sheet, and Cash Flow data for companies in Yahoo Finance using Python and Pandas, and how to export the result to an Excel file for further analysis.
Enjoyed this article? Follow me on Twitter
Any questions, feedback, or anything that you think I’d be interested in? Please leave a comment below.